Inside the Museum Experience
What 5,829 Google reviews reveal about visitor satisfaction, service, and the experiences that shape a museum visit.
5,829 Google Reviews
59 Museums
4.51/5 Average Rating

Date
February - August 2025
Methods
Data Visualization, Exploratory Data Analysis
Tools
Python, Google CoLab, Tableau Public
The Big Picture
The challenge
Museum experiences go beyond exhibitions. Navigation, staff interactions, accessibility, and crowding can all influence visitor satisfaction.
The opportunity
The Approach
The Goal
Research Question & Project
Research Question
What do visitor reviews reveal about museum satisfaction, and which aspects of the visitor experience deserve closer attention?
Intended Audience
Museum experience designers, visitor services teams, and museum administrators seeking to better understand visitor feedback and identify opportunities for improvement.
What the Numbers Reveal
Before diving into written visitor feedback, I explored the numerical ratings to establish a baseline for overall museum satisfaction. Through three exploratory visualizations, I examined how ratings were distributed, how experiences varied across museums, and how visitor discussion topics appeared over time.
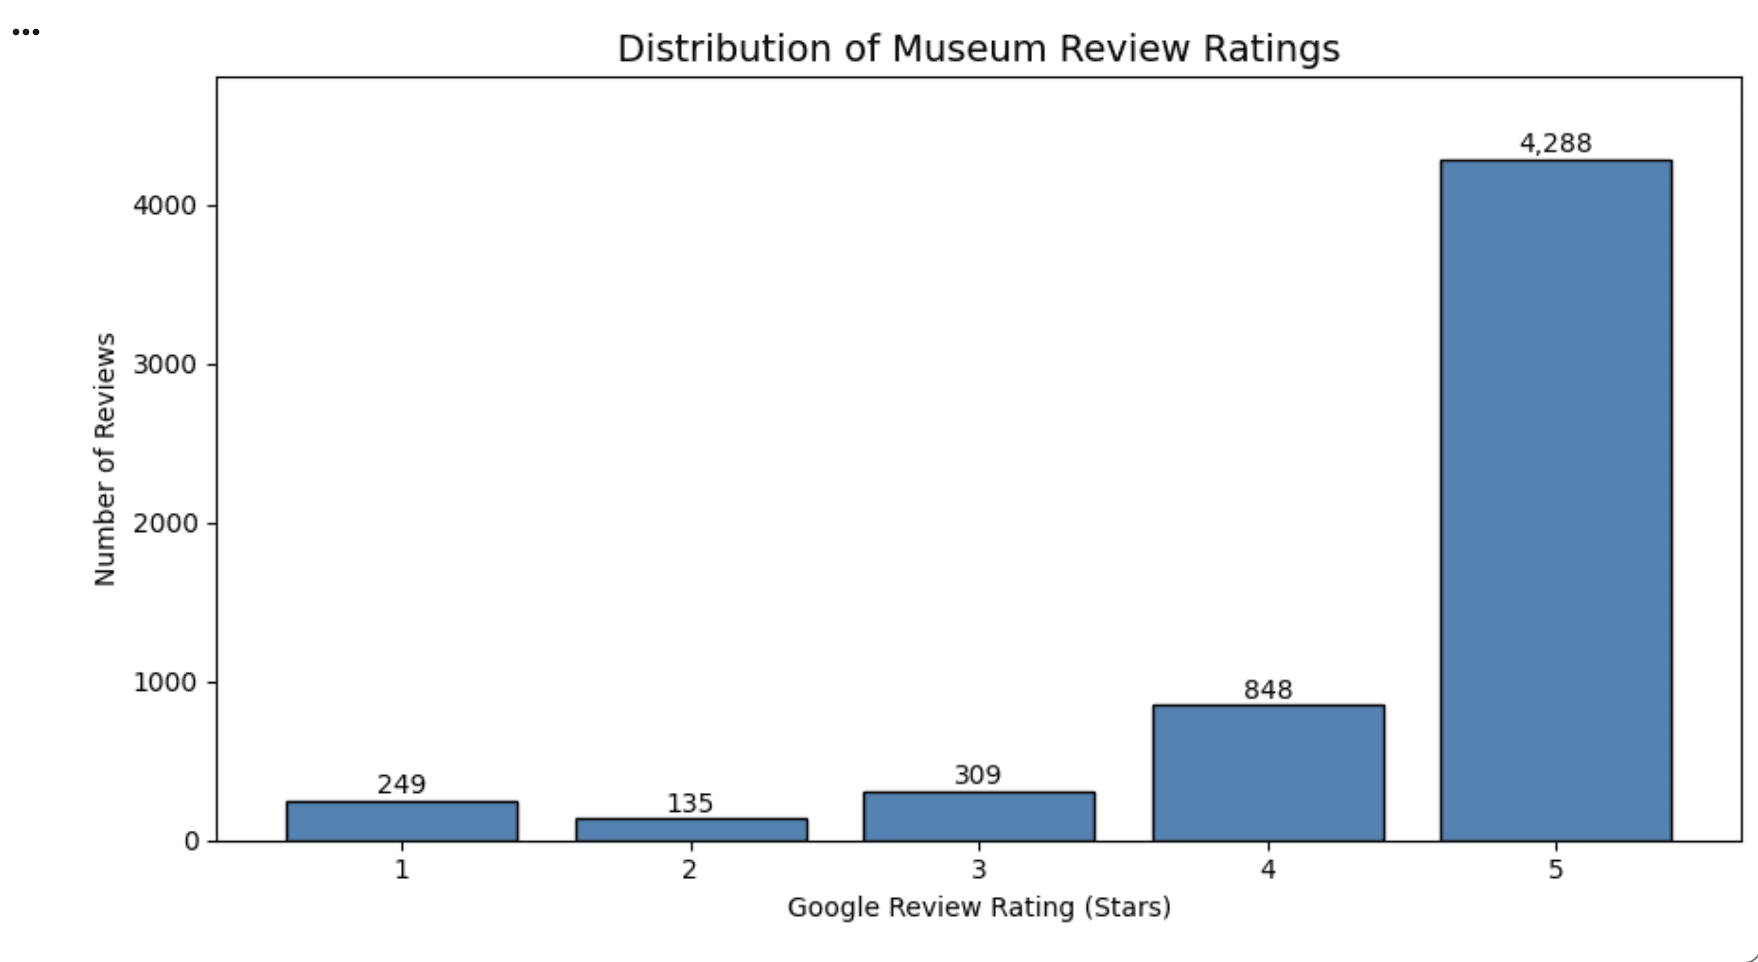
01 / Overall Satisfaction Is High
High Overall Satisfaction: Across 5,829 Google reviews, the average museum rating was 4.51 out of 5 stars.
Strong Positive Skew: 73.56% of reviews received five stars, suggesting that most reviewers reported favorable museum experiences.
Room for Improvement: Despite overwhelmingly positive ratings, the overall average may hide specific challenges in the visitor experience that deserve further investigation.
02 / A Closer Look at Satisfaction
Museum-Level Differences: Average ratings vary across the 59 museums, revealing differences in visitor satisfaction that the overall average of 4.51 stars may hide.
Importance of Context: Museums have different numbers of reviews, so a high average based on fewer reviews may be less representative than one supported by a larger sample.
Opportunity for Improvement: Comparing museums can help identify where further investigation may be useful, but ratings alone cannot explain why certain museums perform differently.


03 / Tracking Visitor Experience Trends Over Time
Recurring Visitor Concerns: Topics such as accessibility, convenience, staff responsiveness, and facilities appeared throughout the reviews from 2022 to 2024.
Changes in Discussion Volume: The number of reviews associated with these topics varied over time, with a noticeable increase in recorded topic mentions in 2024.
Interpreting Trends Carefully: These changes may reflect differences in review collection or sampling rather than actual shifts in visitor priorities. More consistent data would be needed to confirm long-term trends.
While quantitative analysis reveals patterns in ratings and discussion topics, it doesn't fully explain what visitors experienced. To explore these experiences more deeply, I analyzed written reviews to identify recurring qualitative themes.
Understanding what visitors experience, not just how they rate it.
To uncover patterns beyond numerical ratings, I analyzed written Google reviews using keyword-based theme coding. I identified six recurring aspects of the museum experience, including exhibitions, staff interactions, admission, navigation, crowding, and facilities.
Of the 5,829 reviews, 3,758 mentioned at least one identified theme, resulting in 6,712 total theme mentions. Because reviews could belong to multiple categories, the themes are not mutually exclusive.

04 / Beyond the Ratings: What Visitors Experience
Exhibitions Are a Strength: Exhibitions & Art was the most frequently identified theme, appearing in 2,665 reviews, with an average associated rating of 4.48/5.
Staff-Related Experiences Deserve Attention: Reviews mentioning Staff & Service had the lowest theme-associated average rating (3.78/5), suggesting an area worth investigating further.
Different Experiences, Different Ratings: The heatmap shows how ratings vary across qualitative themes, helping identify patterns that overall satisfaction scores might hide.
Explore the Data
Static visualizations highlight the main findings, but they only tell part of the story. I developed an interactive Tableau dashboard to let visitors explore patterns across museums, review ratings, discussion topics, and qualitative experience themes. Use the filters to investigate how visitor experiences differ across the dataset.
Key Findings & Limitations
01 / Exhibitions Are a Major Strength
Positive Overall Experience: The average rating across 59 museums was 4.51/5, with 73.56% of reviews receiving five stars.
Exhibitions Stand Out: Exhibitions & Art appeared in 2,665 reviews, with a theme-associated average rating of 4.48/5.
Key Takeaway: Museums should continue investing in engaging exhibitions while examining other parts of the visitor journey.
02 / The Visitor Experience Goes Beyond Art
Operational Challenges: Reviews mentioning navigation, crowding, and facilities were associated with comparatively lower average ratings.
Staff Interactions: Staff & Service had the lowest theme-associated average rating at 3.78/5.
Key Takeaway: Museums should investigate how visitor support, wayfinding, and operational processes could be improved.
03 / High Ratings Don't Tell the Whole Story
Hidden Differences: Overall satisfaction is high, but ratings vary across museums and experience themes.
Value of Written Feedback: Qualitative review analysis reveals recurring topics that a single star rating cannot explain.
Key Takeaway: Combining quantitative and qualitative analysis provides a more complete picture of visitor experiences.
Limitations to Consider
This analysis uses self-selected Google reviews, which may not represent all museum visitors. Qualitative themes were identified through keyword matching, and their associated ratings reflect entire reviews rather than sentiment toward individual themes. The findings reveal patterns and opportunities for further investigation, not direct causes of satisfaction or dissatisfaction.
Proposed A/B Test
How might we help first-time museum visitors navigate exhibitions more easily?
Our analysis identified navigation and accessibility as areas worth investigating further. To explore a potential improvement, I designed a proposed A/B test comparing traditional museum navigation with an interactive digital navigation experience.
A / Current Experience - Control Group
Visitors navigate the museum using existing signage, printed maps, and available staff assistance.
B / Proposed Experience — Test Group
Visitors use an interactive digital navigation app featuring a 3D museum map and live location guidance to help them find exhibitions.
How Success Would Be Measured✨
Target Audience: First-time adult museum visitors.
Primary Metric: Percentage of visitors who reach their intended exhibition within five minutes.
Test Duration: Four weeks of visitor recruitment and testing.
Success Criteria: A practical improvement of at least 10 percentage points in the five-minute arrival rate.
Additional Measure: Visitor satisfaction with the navigation experience.
Expected Impact
If the interactive navigation experience helps more visitors reach exhibitions efficiently without reducing satisfaction, museums could consider further testing or developing the solution.
Reflections & What's Next
Turning visitor feedback into opportunities for improvement.
Analyzing 5,829 Google reviews across 59 museums helped me understand how quantitative ratings and qualitative feedback can complement each other. While overall visitor satisfaction was high, examining recurring experience themes revealed areas that deserve closer attention.
What I Learned
Look Beyond Averages: High overall ratings can hide differences between museums and visitor experiences.
Combine Methods: Quantitative analysis reveals patterns, while qualitative coding adds context to what visitors discuss.
Interpret Findings Carefully: Associations between review themes and ratings do not establish what caused satisfaction or dissatisfaction.
Opportunities for Future Research
More Precise Sentiment Analysis: Use sentence-level or theme-specific sentiment analysis to better understand how visitors feel about individual experiences.
Additional Visitor Research: Conduct interviews or surveys to validate patterns identified in online reviews.
Test Potential Solutions: Run the proposed navigation A/B test to evaluate whether digital wayfinding improves the visitor experience.